SUCCESS Academy was chartered in 2005 as a cooperative partnership between the Iron and Washington County School Districts, Southern Utah University, Utah Tech University, and the generous support of the Bill and Melinda Gates foundation. In cooperation with the School Land Trust committee, Board of Trustees, students, teachers, parents, and our chartering organizations, the following data was reviewed to identify and focus upon the school's performance over the years.
The percentage of students in SUCCESS Academy graduating with their Associate of Science Degree.
| 5 Year Average | Class of 2018 | Class of 2019 | Class of 2020 | Class of 2021 | Class of 2022 |
|---|---|---|---|---|---|
| 80.83% | 93.33% | 61.25% | 95.12% | 72.22% | 82.22% |
The ACT test provides a general overview of the academic achievement of our students.
| ACT Report for Senior Class | 5 Year Average | Class of 2018 | Class of 2019 | Class of 2020 | Class of 2021 | Class of 2022 |
|---|---|---|---|---|---|---|
| ACT English | 24.16 | 24.94 | 24.46 | 23 | 23.35 | 23.07 |
| ACT Math | 25.78 | 25.9 | 26.4 | 25.44 | 25.12 | 26.02 |
| ACT Reading | 25.3 | 25.15 | 26.06 | 25 | 25.19 | 25.12 |
| ACT Science | 24.96 | 24.43 | 25.7 | 25 | 23.74 | 25.95 |
| ACT Composite | 25.12 | 25.78 | 25.8 | 24.8 | 24 | 25.24 |
| Total Tested | 40.4 | 32 | 49 | 41 | 36 | 44 |
This chart shows the percentage, by subject, for a student's college readiness according to ACT benchmarks testing. College benchmarks are based upon English 18, Math 22, Reading 21 and Science 24 classes.
| Percent at Benchmarks | Five Year Average | Class of 2018 | Class of 2019 | Class of 2020 | Class of 2021 | Class of 2022 |
|---|---|---|---|---|---|---|
| ACT English | 85.31% | 100% | 75.51% | 85.37% | 86.11% | 79.55% |
| ACT Math | 78.56% | 81% | 75.51% | 70.73% | 77.78% | 87.8% |
| ACT Reading | 73.43% | 72% | 73.47% | 73.17% | 77.78% | 70.73% |
| ACT Science | 59.38% | 70% | 61.22% | 56.1% | 52.78% | 56.82% |
| Meeting All Four | 52.37% | 47% | 55.1% | 48.78% | 50% | 60.98% |
| Total Tested | 43.4 | 47 | 49 | 41 | 36 | 44 |
| Fall Semester | 5 Year Average | 2017-2018 | 2018-2019 | 2019-2020 | 2020-2021 | 2021-2022 |
|---|---|---|---|---|---|---|
| A | 35.26% | 37.53% | 32.9% | 29.1% | 39.1% | 37.67% |
| A- | 14.03% | 14.79% | 13.29% | 18.24% | 11.28% | 12.56% |
| B+ | 9.68% | 9.93% | 10.02% | 10.45% | 7.02% | 10.99% |
| B | 13.49% | 13.69% | 14.16% | 12.5% | 16.79% | 10.31% |
| B- | 8.58% | 8.17% | 8.71% | 8.4% | 7.52% | 10.09% |
| C+ | 4.7% | 3.75% | 6.32% | 5.12% | 4.26% | 4.04% |
| C | 5.77% | 4.19% | 5.66% | 6.97% | 5.76% | 6.28% |
| C- | 3.06% | 2.87% | 3.27% | 4.1% | 1.25% | 3.81% |
| D+ | 1.18% | 1.37% | 0.87% | 0.87% | 1.37% | 1.39% |
| D | 1.14% | 0.88% | 1.31% | 2.05% | 1.00% | 0.45% |
| D- | 0.55% | 0.22% | 0.87% | 0.41% | 1.00% | 0.22% |
| F | 1.82% | 1.32% | 1.96% | 1.23% | 3.01% | 1.57% |
| Unofficial Withdrawal | 0.29% | 0.22% | 0.22% | 0.00% | 1.00% | 0.00% |
| Withdrawal | 0.28% | 1.10% | NA | 0.00% | 0.00% | 0.00% |
| Total Grades | 2245 | 453 | 459 | 488 | 399 | 446 |
| Spring Semester | 5 Year Average | 2017-2018 | 2018-2019 | 2019-2020 | 2020-2021 | 2021-2022 |
|---|---|---|---|---|---|---|
| A | 42.05% | 41.59% | 35.77% | 42.70% | 42.28% | 47.93% |
| A- | 11.09% | 12.96% | 12.2% | 10.85% | 10.29% | 9.15% |
| B+ | 8.02% | 8.12% | 7.52% | 7.3% | 9.74% | 7.41% |
| B | 11.07% | 10.44% | 10.57% | 10.5% | 12.5% | 11.33% |
| B- | 6.94% | 8.9% | 7.72% | 3.74% | 7.17% | 7.19% |
| C+ | 4.24% | 3.87% | 5.28% | 5.34% | 3.68% | 3.05% |
| C | 4.92% | 5.42% | 6.5% | 3.74% | 5.88% | 3.05% |
| C- | 2.13% | 1.55% | 2.24% | 3.2% | 1.47% | 2.18% |
| D+ | 1.4% | 1.35% | 2.24% | 1.07% | 1.47% | 0.87% |
| D | 0.91% | 0.97% | 1.42% | 0.53% | 0.55% | 1.09% |
| D- | 0.77% | 0.58% | 0.41% | 1.07% | 0.92% | 0.87% |
| F | 2.79% | 1.35% | 5.08% | 1.25% | 3.68% | 2.61% |
| Unofficial Withdrawal | 1.17% | 1.55% | 1.42% | 1.25% | 0.55% | 1.09% |
| Withdrawal | 0.34% | 1.35% | NA | 0.00% | 0.00% | 0.00% |
| Total Grades | 2573 | 517 | 492 | 561 | 544 | 459 |
SUCCESS Academy continues to grow and grow. Students must fill out an application which then goes into a lottery system to be admitted into SUCCESS Academy.
| SUCCESS Academy Enrollment | Five Year Average | 2017-2018 | 2018-2019 | 2019-2020 | 2020-2021 | 2021-2022 |
|---|---|---|---|---|---|---|
| October | 408.20 | 449 | 482 | 374 | 362 | 374 |
| May | 392.6 | 439 | 452 | 372 | 355 | 345 |
| Percent Change | 2.23% | 6.22% | 0.53% | 1.93% | 7.75% |
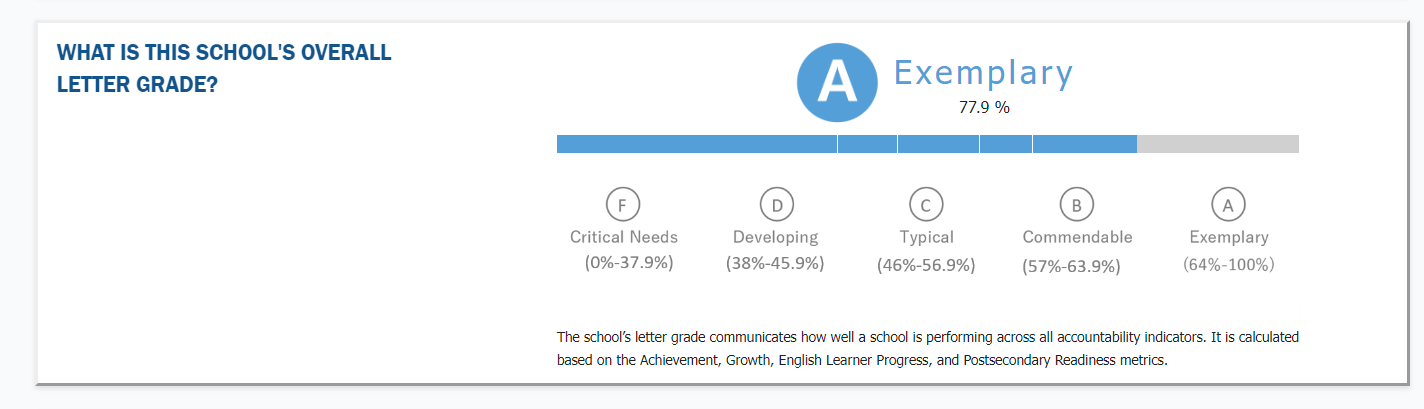
This year SUCCESS Academy received a "A" grade from the Utah State Office of Education. (The USOE lists both SUU and UTU under SUU SUCCESS, but the data is for both campuses.) To see more information on our school's grade, go to the Overall Performance. Or to see our school, plus other schools, go to the DataGateway.